Build Beautiful Diagrams Free & Instantly
Flowcharts, Venn diagrams, org charts, pie charts, and mind maps — all free, all in your browser. Drag-and-drop editors, AI generation, 7 visual themes, and export to PNG, SVG, JSON, or Mermaid.
No account required. No credit card. No watermarks. Just open and build.
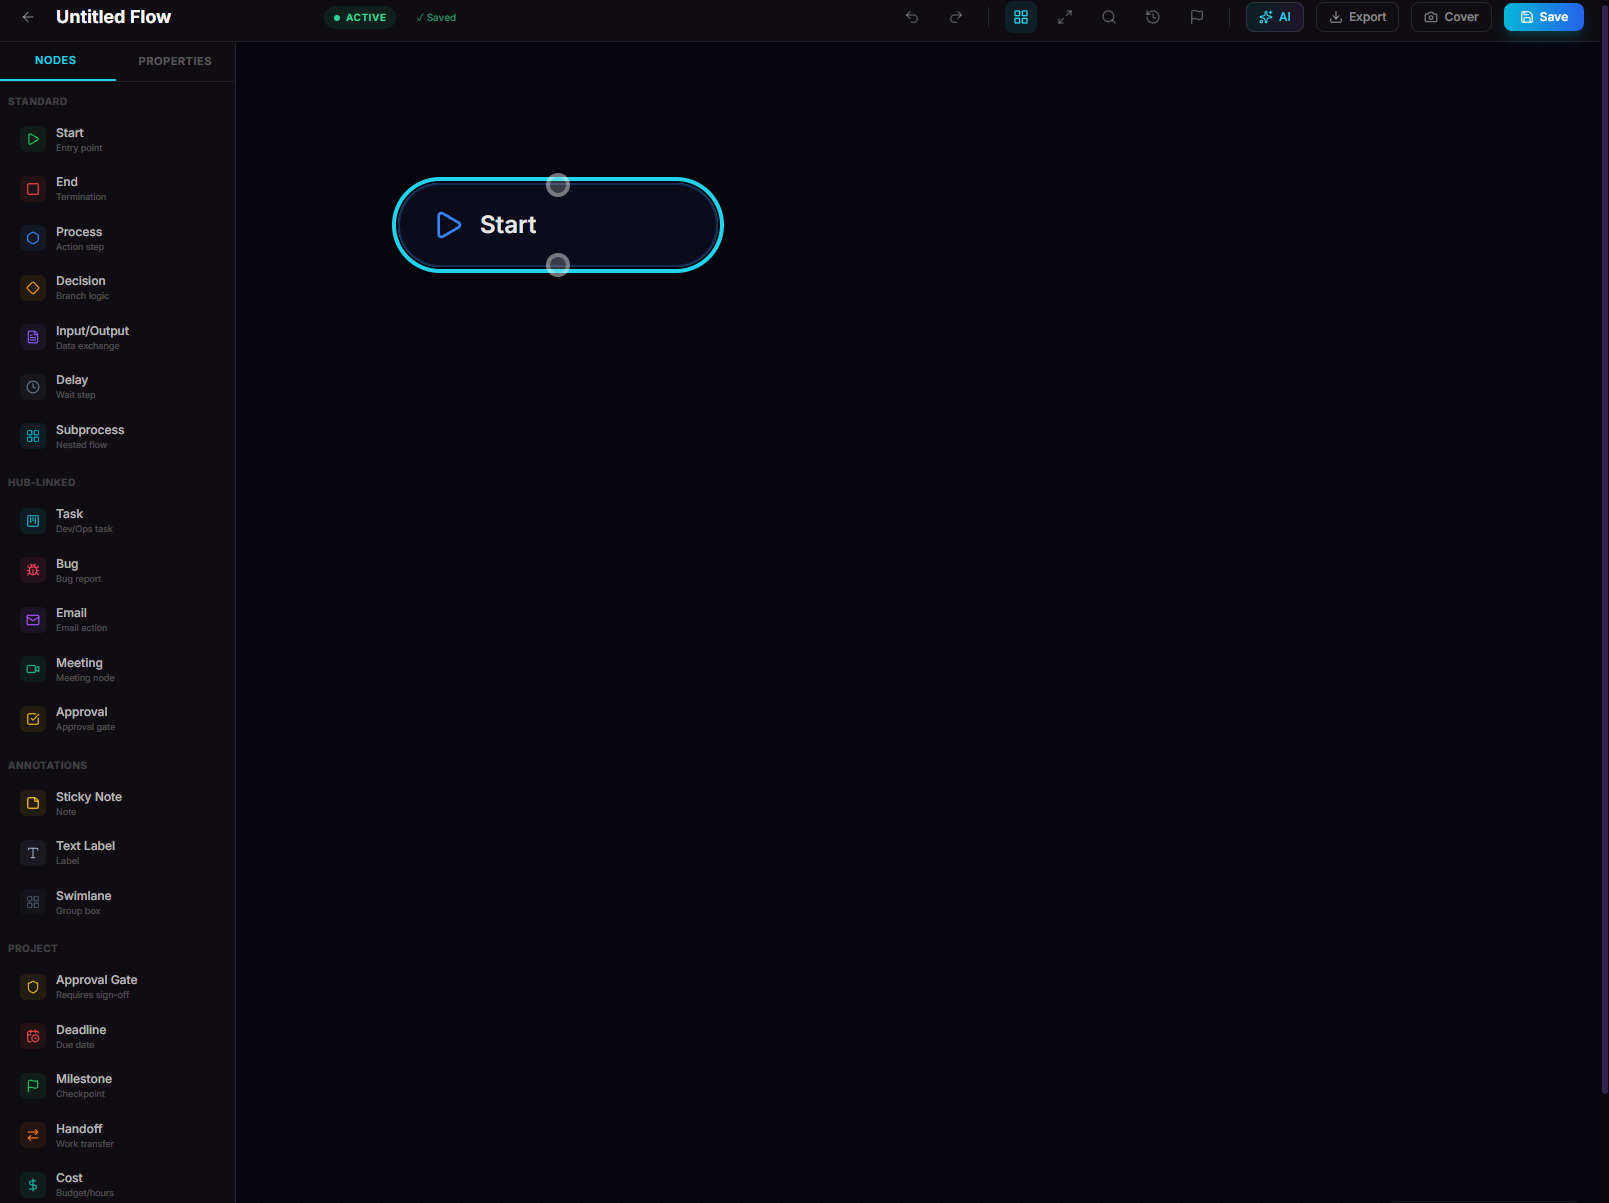
Everything You Need to Create Professional Flowcharts
From simple process maps to complex system architectures — FreeFlowCharts gives you the tools without the price tag.
20+ Node Types
Start, end, process, decision, I/O, delay, subprocess, task, bug, email, meeting, approval, milestones, deadlines, handoffs, costs, sticky notes, swimlanes, and more.
AI Across All 5 Diagram Types
Describe what you want in plain English and let AI build it — flowcharts, org charts, pie charts, mind maps, and Venn diagrams all support AI generation, plus type-specific smart features like suggestions, insights, and auto-fix.
7 Visual Themes
Choose from Default, Neon, Pastel, Retro, Ocean, Brutalist, or Candy themes. Set custom background colors or gradients to match your brand.
Export Anywhere
Export your flowcharts as high-resolution PNG images, scalable SVG vectors, structured JSON data, or Mermaid syntax for embedding in GitHub, Notion, and Markdown docs.
Live Sharing
Generate a unique shareable URL for any flowchart. Recipients see an interactive, zoomable view — no login required. Embed in any website with a single iframe tag.
Free REST API
Create flowcharts, Venn diagrams, org charts, pie charts, and mind maps programmatically. No API key required. Perfect for AI agents, chatbots, and automation. 30 req/hr.
No Signup Required
Start building immediately without creating an account. Your work auto-saves to your browser. Sign in only when you want permanent cloud storage, sharing, or AI features.
Version History
Save named snapshots of your flowcharts at any time. Restore previous versions with one click. Never lose work again.
Free Diagram Tools
Five diagram types, all free, all in your browser. No signup required for any of them.
How It Works
Three steps. Zero friction. Build your first flowchart in under a minute.
Open the Editor
Click "Start Building" below — no signup, no email, no credit card. You'll land directly on the drag-and-drop canvas.
Add Nodes & Connect
Pick from 20+ node types in the sidebar. Drop them onto the infinite canvas, then drag edges between them to create your flow.
Customize & Export
Apply themes, change colors, add descriptions. Export as PNG, SVG, JSON, or Mermaid. Share via a live link or embed in your docs.
Built for Every Use Case
Whether you're documenting a deployment pipeline or planning a recipe — FreeFlowCharts adapts to your workflow.
Software Engineering
Map out system architectures, deployment pipelines, CI/CD workflows, and API request flows.
Product Management
Visualize user journeys, feature decision trees, sprint workflows, and approval processes.
Education
Create lesson plans, algorithm visualizations, biology processes, and student assignment flows.
Business Operations
Document onboarding procedures, expense approvals, support escalation paths, and inventory workflows.
Marketing
Plan campaign funnels, content calendars, email automation sequences, and A/B test decision trees.
Personal Projects
Organize recipes, travel plans, home renovation steps, or any multi-step process in your life.
What Is a Flowchart?
A flowchart is a diagram that represents a workflow, process, or algorithm as a sequence of steps connected by arrows. Each step is shown as a shape — rectangles for processes, diamonds for decisions, ovals for start and end points, and parallelograms for input/output operations. Flowcharts make complex logic visual and easy to follow.
Flowcharts were first introduced by Frank Gilbreth in 1921 as "process flow charts" for the American Society of Mechanical Engineers (ASME). They became widely adopted in computer science during the 1960s and 1970s for documenting program logic before code was written. Today, flowcharts are used across every industry — from software engineering and project management to healthcare, education, manufacturing, and business operations.
Standard Flowchart Symbols
The ISO 5807 standard defines the shapes used in flowcharts. The most common symbols include: Oval (Terminator) — marks the start or end of a process; Rectangle (Process) — represents an action or operation; Diamond (Decision) — indicates a yes/no or true/false branch; Parallelogram (Input/Output) — shows data entering or leaving the system; Arrow (Flow Line) — connects steps and shows the direction of flow.
Types of Flowcharts
There are several types of flowcharts, each suited to different purposes. Process flowcharts document step-by-step procedures. Swimlane flowcharts divide processes by team or department to show responsibility. Data flow diagrams track how information moves through a system. Decision trees map out branching logic for troubleshooting or classification. FreeFlowCharts supports all of these with 20+ node types and customizable connections.
Why Use Flowcharts?
Flowcharts improve communication by turning abstract processes into visual representations that anyone can understand. They help teams identify bottlenecks, redundant steps, and decision points in their workflows. In software development, flowcharts are invaluable for planning algorithms, debugging logic errors, and onboarding new team members. In business, they standardize procedures, support compliance auditing, and reduce training time for new employees.
What Is a Venn Diagram?
A Venn diagram uses overlapping circles to illustrate the logical relationships between two or more sets of items. Each circle represents a set, and the areas where circles overlap represent elements that belong to multiple sets. Venn diagrams are one of the most intuitive tools for comparing and contrasting groups, concepts, or categories.
Venn diagrams were popularized by John Venn in 1880, though similar diagrams were used by Leonhard Euler as early as 1768. They are fundamental to set theory in mathematics and are widely used in statistics, logic, linguistics, computer science, and education. In business contexts, Venn diagrams are commonly used for market analysis, product feature comparisons, audience segmentation, and the popular "Ikigai" framework for finding purpose.
Common Venn Diagram Types
A two-circle Venn diagram compares two sets and shows their intersection. A three-circle Venn diagram reveals seven distinct regions — three individual areas, three pairwise overlaps, and one triple intersection. FreeFlowCharts supports up to eight circles, enabling complex multi-set analysis with automatic region detection and label placement using pixel-accurate centroid calculation.
Venn Diagrams in Practice
In education, Venn diagrams help students compare literary characters, historical events, or scientific concepts. In data science, they visualize set intersections in survey responses or user cohorts. Product teams use them to map feature overlap between competitors. The Ikigai Venn diagram — with four overlapping circles for "What you love," "What you're good at," "What the world needs," and "What you can be paid for" — has become one of the most shared diagram formats on the internet.
FreeFlowCharts lets you create Venn diagrams both in the visual editor and via the free REST API. Labels are automatically positioned at the visual centroid of each region, and diagrams can be exported as PNG, SVG, or JSON for embedding anywhere.
Frequently Asked Questions
What Is an Org Chart?
An organizational chart (org chart) is a hierarchical tree diagram that shows the structure of a company, department, or team. Each box represents a person or role, and lines connect them to their manager or direct reports. Org charts make reporting relationships, team boundaries, and leadership structures immediately visible.
Org charts are used across industries for onboarding new hires, planning restructures, identifying bottlenecks in communication, and presenting team structures to stakeholders. The FreeFlowCharts org chart editor auto-lays out the tree, assigns colors by depth, and exports to PNG, JSON, or SVG — all without signup.
What Is a Pie Chart?
A pie chart is a circular graph divided into slices, where each slice represents a proportion of the whole. The angle of each slice is proportional to its value, making it easy to see how parts relate to the total. A donut chart is a pie chart with a hole in the center — it looks cleaner and can display a summary value.
Pie charts are ideal for showing market share, budget breakdowns, survey results, and portfolio composition. They work best with 2–7 categories. The FreeFlowCharts pie chart editor calculates percentages automatically, supports donut mode, and offers templates for common scenarios.
What Is a Mind Map?
A mind map is a radial diagram with a central topic at the center and branches radiating outward. Each branch can have sub-branches, creating a tree-like structure that mirrors how ideas naturally connect. Unlike linear notes, mind maps let you see relationships and hierarchies at a glance.
Mind maps are widely used for brainstorming, study notes, project planning, meeting notes, and content outlines. The FreeFlowCharts mind map editor uses automatic radial layout, colors branches by depth, and lets you export to PNG or JSON — all free and in-browser.
Ready to Build Your Diagram?
Five diagram types, all free, all in your browser. No signup. No cost. Just open and create.
Guides & learning resources
Deep tutorials on flowchart symbols, Mermaid for GitHub, CI/CD and onboarding templates, API usage for AI agents, and more — written by the FreeFlowCharts team.